

Experimental Autoimmune Encephalomyelitis (EAE)
Hooke has extensive experience with all commonly-used models of EAE. We can also work with you to develop new or modified models; our founder is Suzana Marusic, MD, PhD, a pioneer in development of adoptive transfer EAE models in C57BL/6 mice [3][4]; we believe Hooke is the leading EAE CRO in the world.
At Hooke we routinely run the following EAE models (click on any model for details and typical results):
| EAE model | Duration (days) |
Description |
|---|---|---|
| Adoptive transfer EAE (in SJL or C57BL/6 mice) |
35 to 40 | Sensitive and robust. Can be made Th1 or Th17 dominant. Permits study of cell trafficking (in C57BL/6 mice). Isolates EAE induction phase from effector phase. |
| Glatiramer acetate (GA)/Copaxone API sameness models | 28 | Equivalency testing for Teva Copaxone/generic glatiramer acetate per FDA guidance for generic GA sponsors. Hooke routinely performs these assays. |
| gpMBP69-88/CFA-induced EAE in Lewis rats | 16 to 20 | Shortest EAE model, used when PK data favors rats. |
| MOG/CFA-induced EAE in C57BL/6 mice | 25 to 30 | MOG35-55 model – Least expensive EAE model. Short, very robust.
May be used to test neuronal regeneration. Strong demyelination. Excellent therapeutic window. MOG1-125 model – Similar to MOG35-55 model, but sensitive to B cell targeting. |
| [Ser140]-PLP139-151/CFA-induced EAE in SJL mice | 35 to 60 | Relapsing-remitting model. Highly synchronized EAE onset. Very mild demyelination. |
| MOG35-55 induced EAE in NOD mice | 60 | Secondary progressive EAE. Treatment typically starts ~35 days after immunization. |
For all EAE models, Hooke offers an extensive set of tissue collection and analysis options. Click here for more information.
Multiple sclerosis and EAE
Multiple sclerosis (MS) is a disease of the central nervous system (CNS) that affects over 2 million people; EAE is the most commonly used animal model of MS.
MS is an immune-mediated inflammatory disease affecting the central nervous system which causes demyelination of neurons, axonal damage, and neurodegeneration. CD4+ (Th1, Th17), CD8+ T cells, and B cells are believed to play a role in MS. The disease primarily affects white matter, but demyelination in gray matter also plays an important role. In most cases (> 80%) the disease begins with a relapsing/remitting course.
EAE is induced by CD4+ T cells specific for myelin-derived antigens, either generated after immunization or injected directly. However, B cells are known to be critical for disease development in the MOG1-125-induced EAE model in C57BL/6 mice.
As with MS in human patients, EAE is characterized by paralysis caused by CNS inflammation, demyelination of neurons, axonal damage, and neurodegeneration. Some EAE models exhibit remission and relapse (relapsing-remitting EAE). These similarities to MS make EAE an excellent animal model for evaluation of potential MS treatments. EAE is also considered a model of T cell mediated autoimmune diseases in general.
EAE development
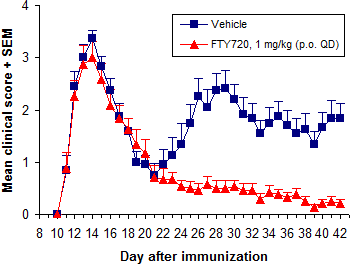
EAE involves an initial wave of paralysis followed by full or partial recovery. In some models this initial recovery is followed by one or more relapses (relapsing-remitting EAE), or by chronic paralysis.
Stress reduces susceptibility to EAE. Administration of treatment during the disease induction period (~0-10 days after immunization) postpones EAE onset and reduces severity, due to stress from compound administration and vehicle effects. The more frequent and stressful the administration, and the less tolerated the vehicle, the greater the impact on disease development.
In C57BL/6 mice the effects of stress are less pronounced if treatment starts after onset of paralysis.
Relative to disease-free controls, animals lose body weight during the acute phase of EAE, followed by partial recovery in the chronic phase.
Direct EAE models
In direct EAE (models listed above), disease is induced by immunization with spinal cord homogenate or myelin-derived antigens such as MOG, PLP, or MBP proteins or peptides.
Direct EAE is generally the first choice for compound evaluation. These models can be used to test compound efficacy in all disease phases, and are generally shorter (and therefore less expensive) EAE models.
Adoptive transfer EAE
Adoptive transfer EAE is a therapeutic model which isolates the induction phase of EAE from the effector phase. Encephalitogenic helper T cells (CD4+) specific for myelin-derived antigens are generated in donor mice by immunization. These cells are then activated in cell culture and injected into recipient mice, where EAE develops.
This model is robust and more sensitive than other therapeutic EAE models. In addition, adoptive transfer EAE allows study of compounds specifically targeting Th1 or Th17 cells and cell trafficking. Click here for more details.
Treatment regimens
In most EAE models, your study can have any of the following treatment regimens:
- Prophylactic (starting from immunization, before any signs of disease)
- Semi-therapeutic (starting when the first animals become sick)
- Therapeutic (from the first signs of disease in each animal - rolling enrollment)
- Late therapeutic (starting a fixed time after immunization or disease onset in each animal - rolling enrollment)
Prophylactic treatment
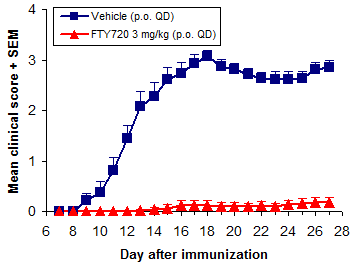
In prophylactic studies mice are treated from the time of immunization and are most often followed for 28 days.
Overall treatment efficacy is indicated by both delayed onset of EAE and reduced maximum severity (vs. negative controls). Of these, mean maximum score (MMS) is more important - reduced MMS indicates an overall reduction in EAE severity. Median time to disease onset is usually the most sensitive measure of compound efficacy because even small changes in immune responses can delay disease onset.
In addition to FTY720 (fingolimod, Gilenya), ibrutinib (Imbruvica), glatiramer acetate (Copaxone), and dimethyl fumarate (BG-12, Tecfidera) are efficacious when dosed prophylactically.
Semi-therapeutic treatment
Semi-therapeutic treatment starts after mice have been immunized, but before all mice are sick. Usually treatment starts 10 to 11 days after immunization, or when 10 to 20% of mice have become sick.
Therapeutic treatment
Therapeutic treatment specifically demonstrates whether a compound will reverse the course of disease or improve recovery. In therapeutic treatment mice are usually enrolled into treatment groups one at a time, at EAE onset for each mouse. Groups are balanced for similar time of EAE onset and severity at enrollment - this gives very uniform groups and makes the model more sensitive to compound efficacy. We often recommend this stringent treatment regimen as a follow-up to prophylactic studies, to establish compound efficacy after disease onset.
Late therapeutic treatment
Late therapeutic treatment is similar to therapeutic treatment, except that treatment begins either a fixed number of days after each mouse shows the first signs of disease, or a fixed period after immunization. Most often, this treatment regimen is used to evaluate neuroregenerative effects.
In addition to day of EAE onset and onset score, groups are also balanced for maximum score before enrollment.
Positive controls
Hooke has established the following as positive controls in EAE:
- Anti-mouse-VLA-4 antibodies - mouse form of natalizumab (Tysabri)
- Corticosteroids (dexamethasone, prednisone, methylprednisolone)
- Dimethyl fumarate (BG-12, Tecfidera)
- Fingolimod (FTY720, Gilenya)
- Glatiramer acetate (Copaxone)
Of these, we use FTY720 (fingolimod, Gilenya) most frequently. It is a very potent inhibitor of EAE development when dosed p.o. at 0.5 mg/kg or more QD. Methylprednisolone and dexamethasone are used often as well.
Copaxone (Teva Pharmaceuticals) is used in MOG35-55/CFA-induced EAE, or in the adoptive transfer EAE model in SJL mice, usually to evaluate efficacy of generic glatiramer acetate.
The best positive control depends on the particular EAE model and the details of your study. Our scientists can help you choose the best model, treatment regimen, and controls to evaluate your compounds.
In vivo readouts
Our usual in vivo readouts for EAE are paralysis score and change in body weight.
Typically, paralysis is scored on a scale of 0 to 5. The scoring method differs slightly depending on the stage of disease (onset/peak vs. recovery). Reliable EAE scoring requires skill which comes after considerable experience. To avoid unconscious bias in scoring, all scoring at Hooke is performed blind, by a person unaware of both treatment and of previous scores for each animal.
Hooke has standardized scoring guidelines for mice and for rats (click for details).
Reporting results
Once or more weekly during your study, we report interim results with raw daily EAE scores and graphs of average EAE scores for each group.
At the end of the study, we perform statistical analysis and issue a final report, normally within 4 weeks of study completion.
Tissue collection and end-of-study analyses
As part of our CRO services, Hooke offers a wide range of tissue collection and analysis. Of course, we are also happy to ship your samples to a lab of your choice anywhere in the world.
Hooke performs:
- Tissue and blood collection (for PK analysis, etc.)
- Histological, immunohistochemical (IHC), and immunofluorescent (IF) analysis of tissue
- Flow cytometric analysis
- CNS-infiltrating, lymph node, spleen cells
- Cell surface staining
- Intracellular staining
-
Analysis of T cell functions in vitro (antigen re-stimulation)
- Cytokine production analysis – ELISA, cytokine bead assay (CBA), Luminex, MSD
- Proliferation analysis (BrdU staining)
Some customers order analysis of all groups in advance, but we generally encourage customers to wait for initial results before deciding which analyses to order.
We usually quote a price for your base study, together with prices for additional analysis that may be ordered later. This gives you flexibility to analyze only a sample of animals, choose particular groups for analysis, or even skip analysis completely if the results aren't promising. Our scientists will review your initial results with you, and can recommend the best analyses to maximize return from your study.
We generally ask for 5 day's notice to schedule tissue collection or analysis (but we do our best to accommodate last-minute orders).
Histological and immunohistochemical (IHC) analysis
Histological and IHC analyses provide additional readouts of drug efficacy, independent of clinical observations. While these analyses provide valuable information about EAE severity, they must be evaluated with a knowledge of the course of EAE.
Tissue sections are typically stained with hematoxylin and eosin (H&E) and anti-MBP. Our standard analysis includes:
- Count of inflammatory foci (H&E)
- Count of apoptotic cells (H&E)
- Estimate of demyelination (anti-MBP)
Other frequently performed analyses include:
- anti-CD4
- anti-Iba1
- anti-GFAP
Typical findings in spinal cords
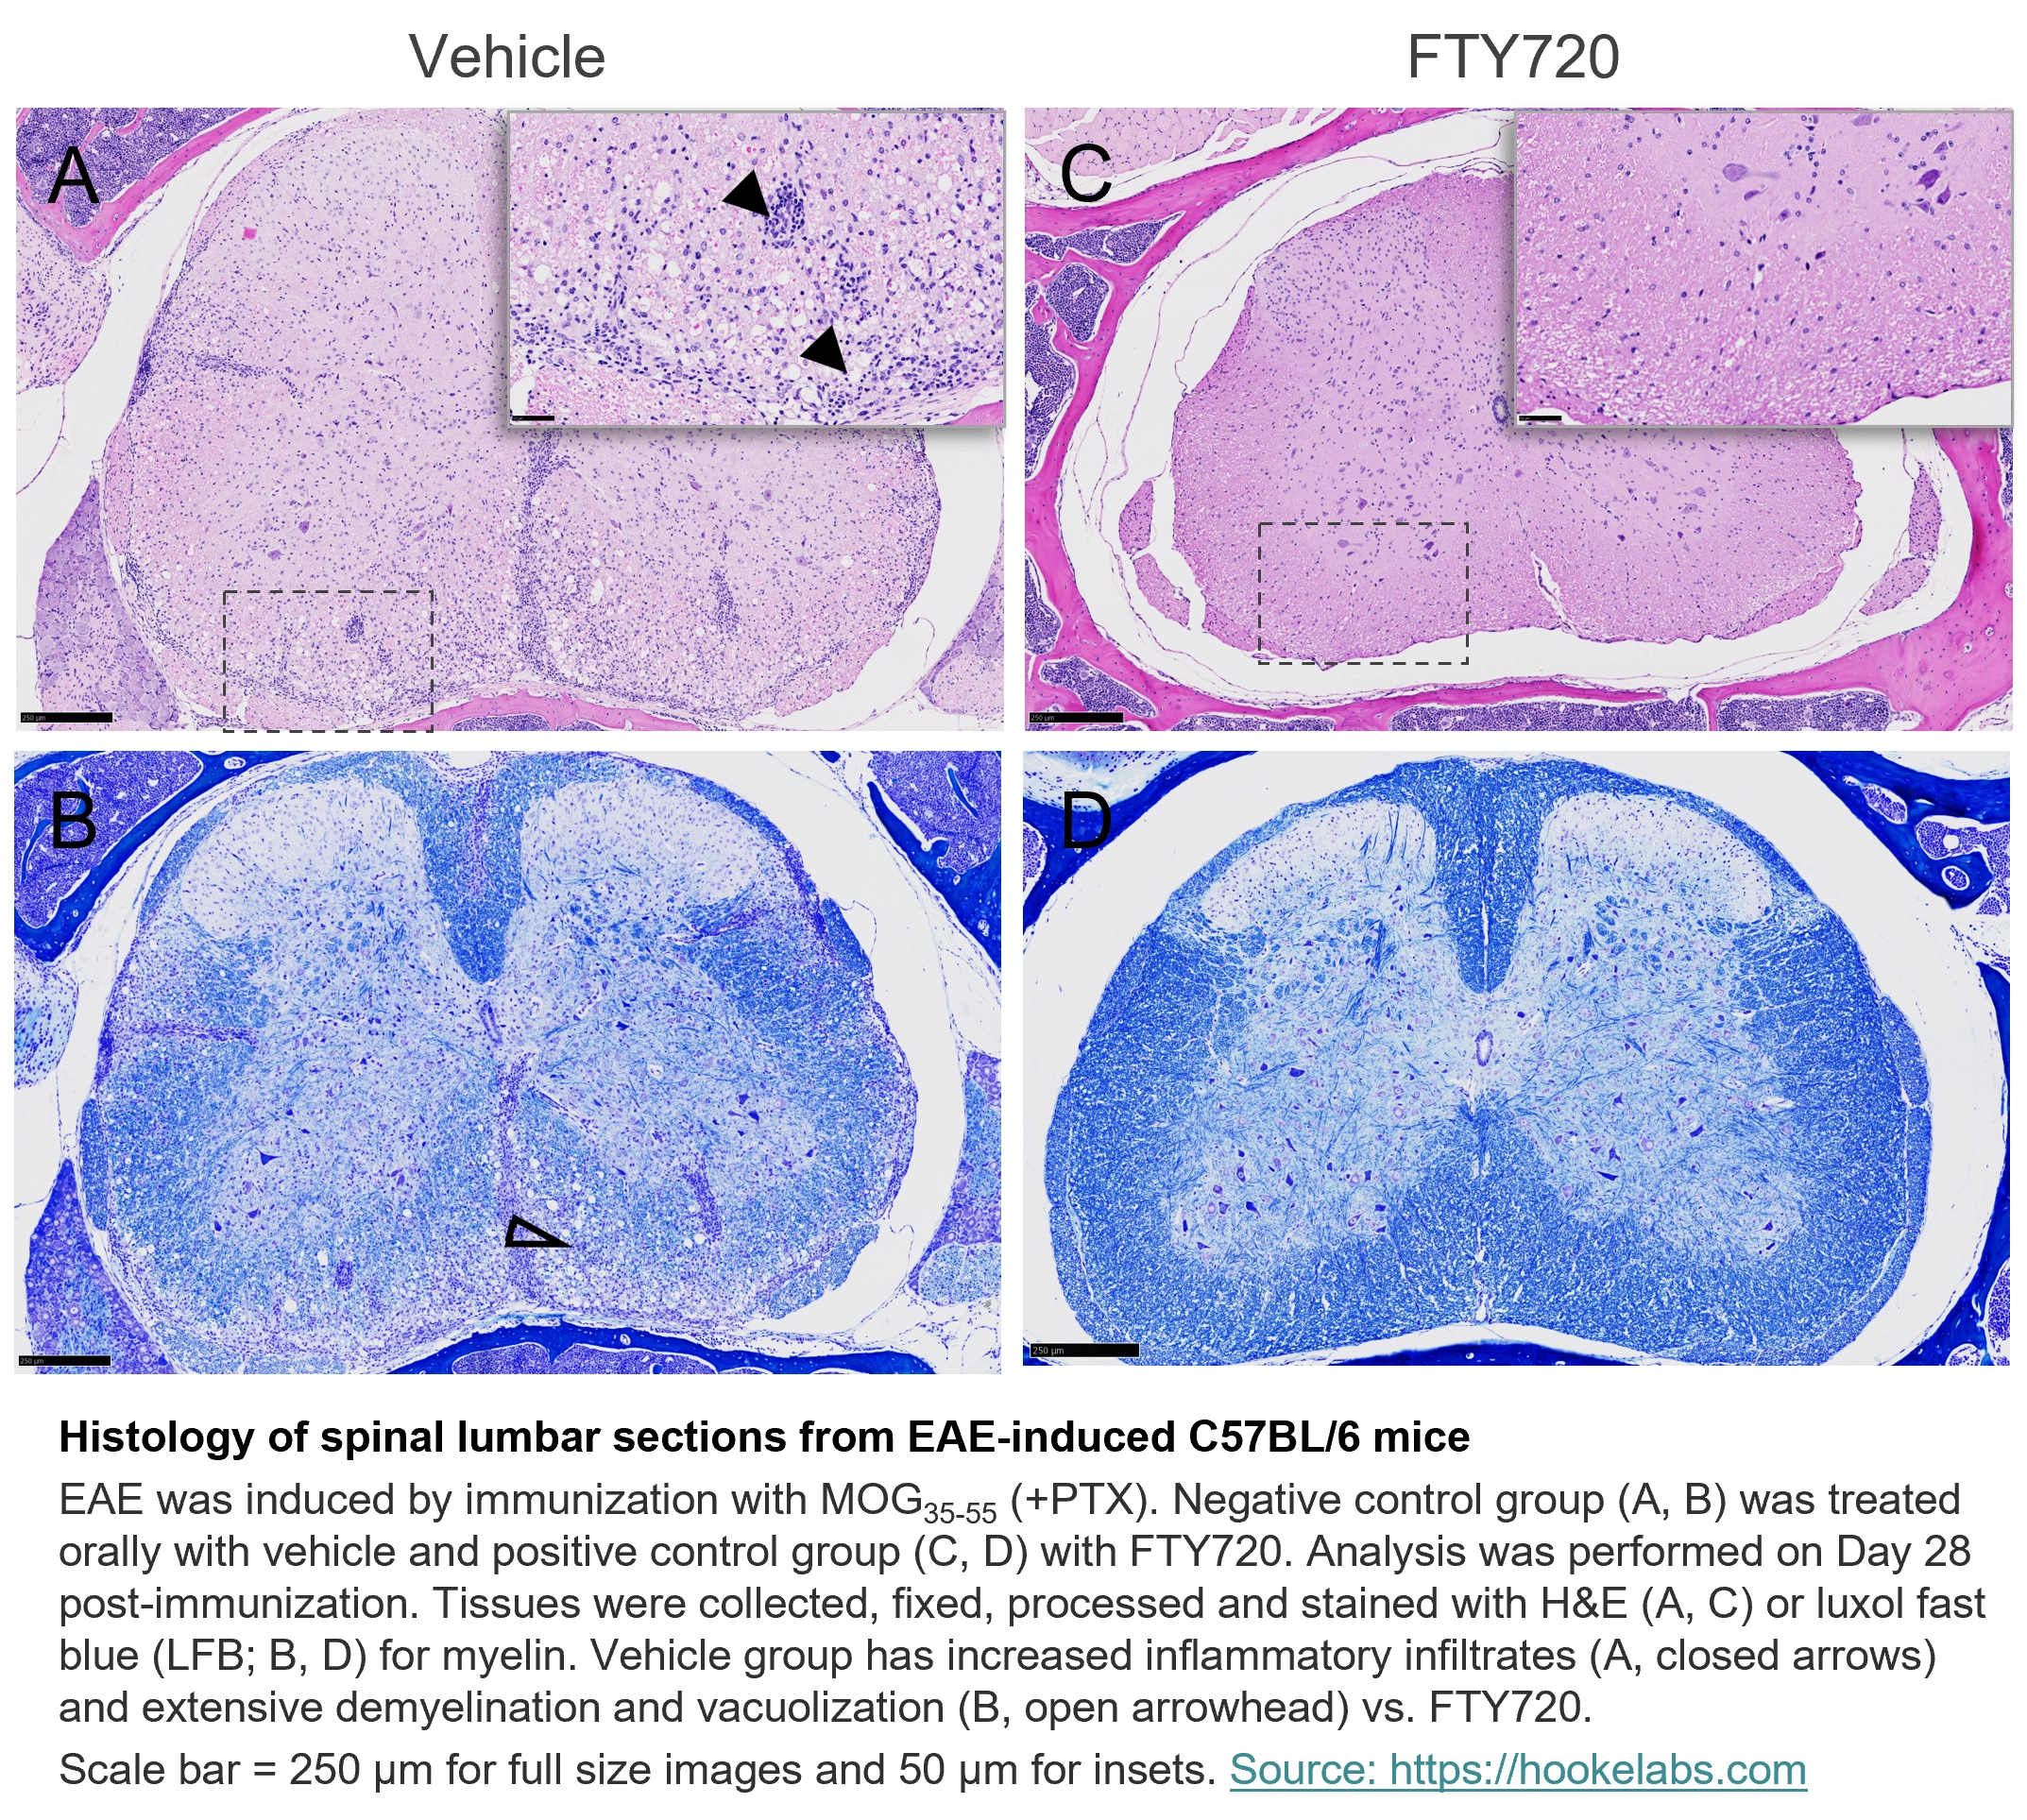
Histology of spinal lumbar sections from EAE-induced C57BL/6 mice
EAE was induced by immunization with MOG35-55 (+PTX). Negative control group (A, B) was treated orally with vehicle and positive control group (C, D) with FTY720. Analysis was performed on Day 28 post-immunization. Tissues were collected, fixed, processed and stained with H&E (A, C) or luxol fast blue (LFB; B, D) for myelin. Vehicle group has increased inflammatory infiltrates (A, closed arrows) and extensive demyelination and vacuolization (B, open arrowhead) vs. FTY720.
Scale bar = 250 µm for full size images and 50 µm for insets.
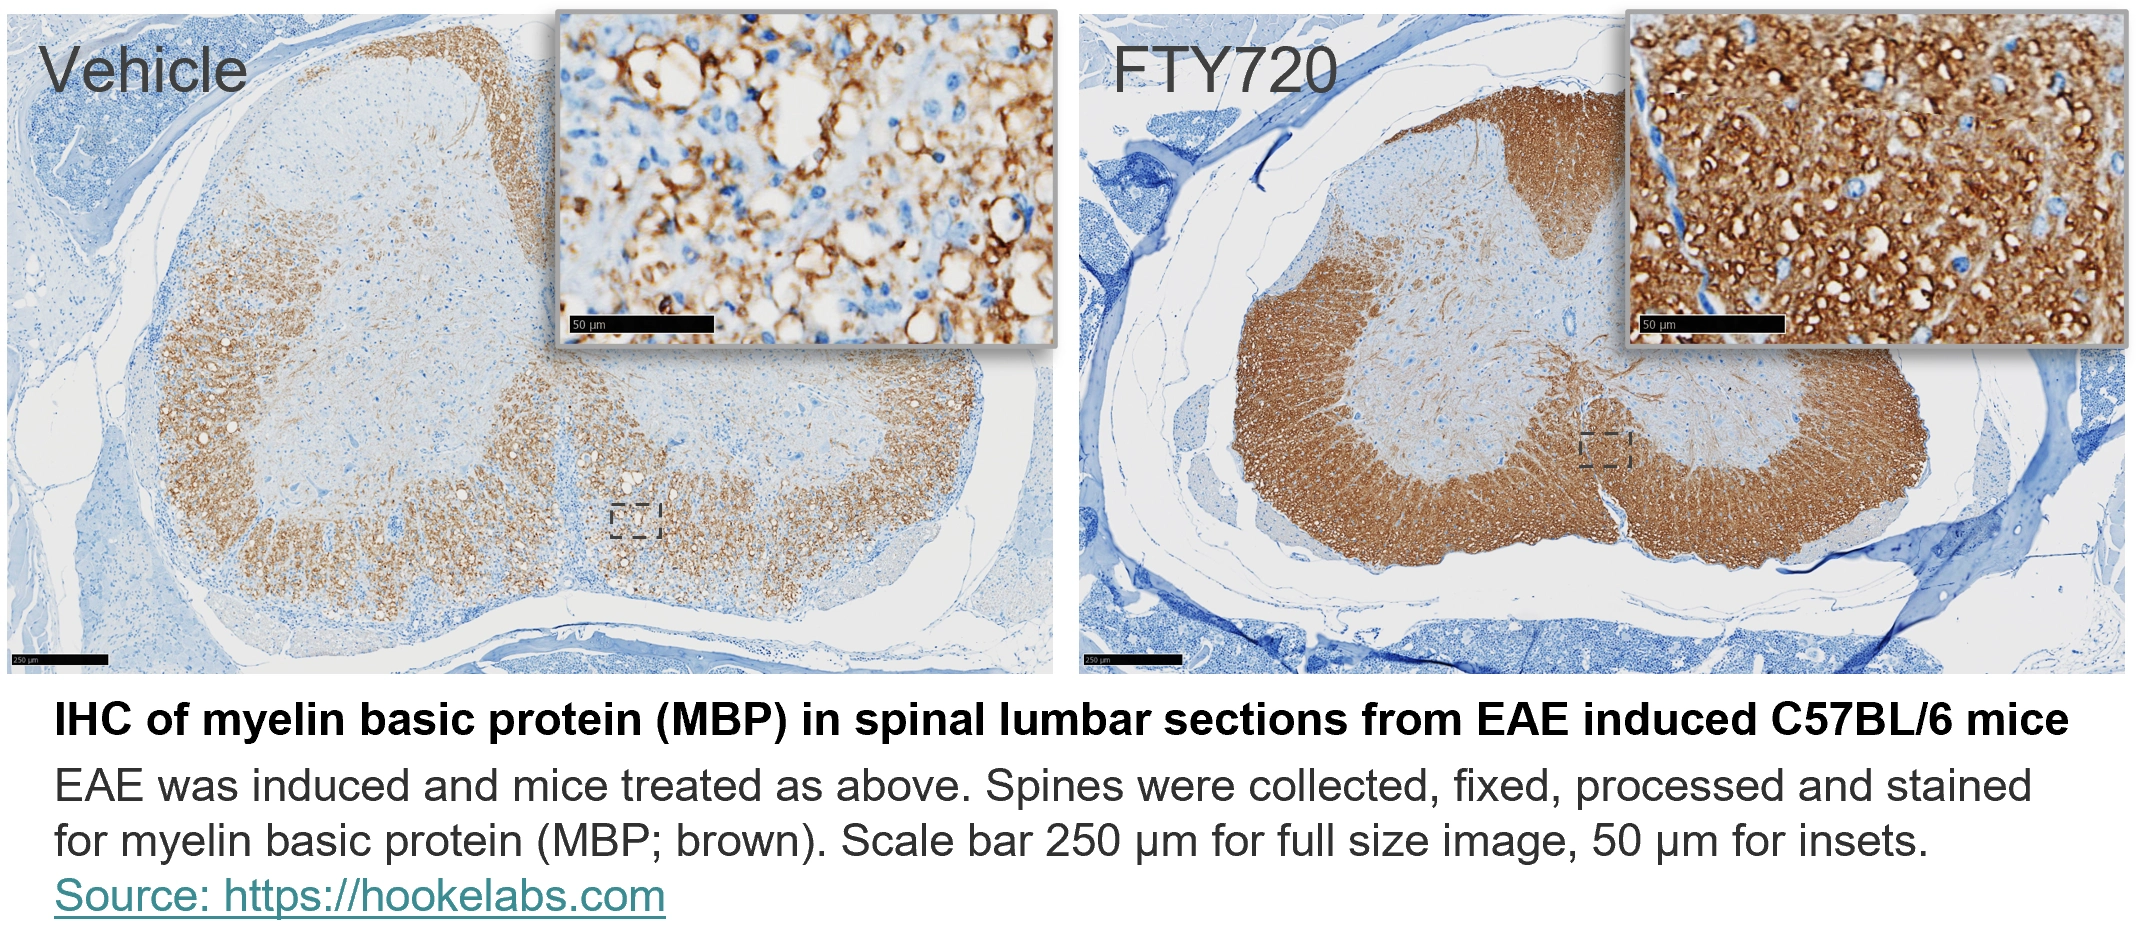
IHC of myelin basic protein (MBP) in spinal lumbar sections from EAE induced C57BL/6 mice
EAE was induced and mice treated as above. Spines were collected, fixed, processed and stained for myelin basic protein (MBP; brown).
Scale bar 250 µm for full size image, 50 µm for insets.
(Click for larger image.)
Flow cytometric analysis
Hooke offers flow cytometric analysis, which can help confirm or identify the mode of action of your compound.
We normally have a wide range of antibodies in stock and routinely perform 15 color analysis. We perform both surface and intracellular staining.
Most often we analyze CNS-infiltrating cells from brain or spinal cord. Spleen and inguinal lymph node cells are also frequently analyzed.
Typical flow cytometric results - CNS-infiltrating cells in chronic EAE
Below are typical results from cell surface and intracellular staining of CNS-infiltrating cells from a C57BL/6 mouse with EAE.
Spinal cords were collected and infiltrating cells isolated using a Percoll gradient, then cells counted.
Cells were placed in culture with phorbol myristate acetate (PMA, 50 ng/mL), ionomycin (1 µg/mL), brefeldin (1 µg/mL), and monensin (1.36 µg/mL) and incubated for 4 to 5 hours, then washed and stained.


Ex vivo T cell function analysis (restimulation with antigen)
Spleen and lymph node cells are restimulated with antigen to analyze cytokine production of T cells in vitro. This can be performed either as a separate study, or the end of an EAE study.
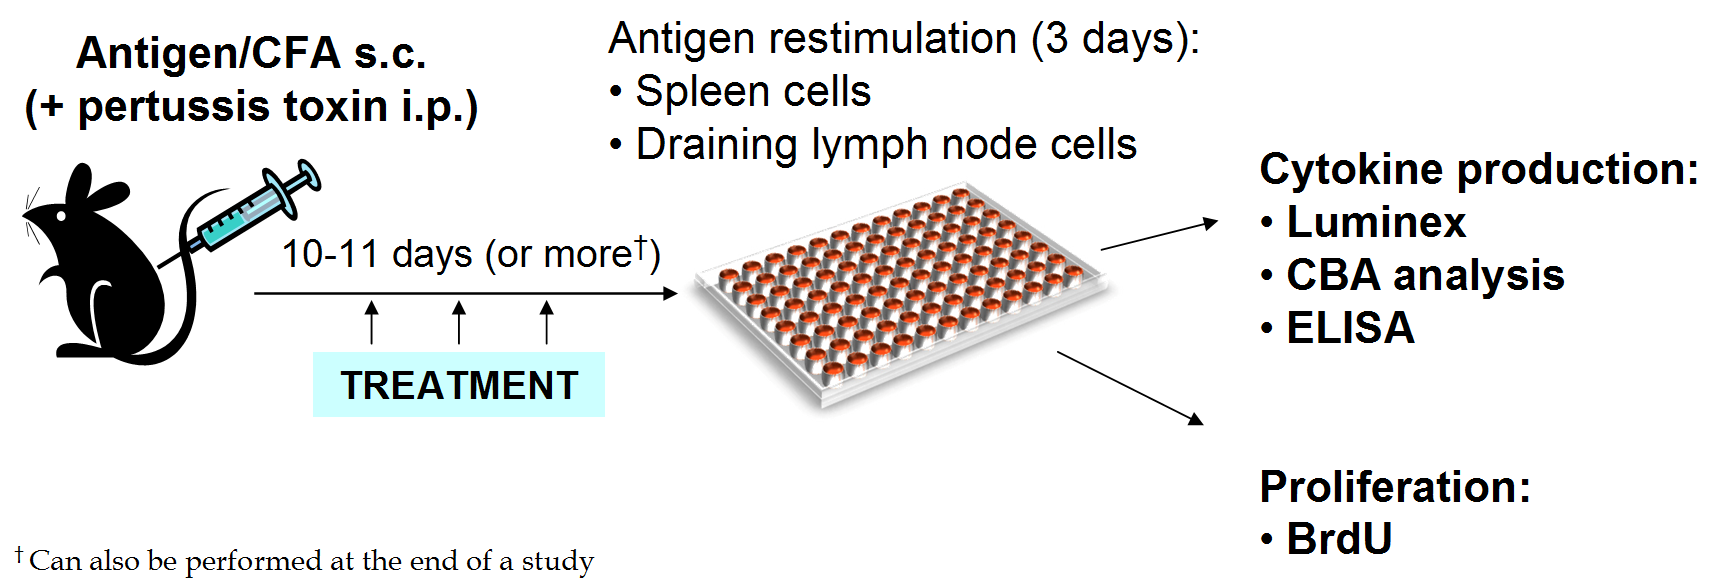
Spleens or lymph nodes are collected and cell suspensions plated in 96-well plates with multiple concentrations of the selected antigen in triplicate.
After 72 hours of culture, supernatants are collected and analyzed for cytokines using Luminex, ELISA, or CBA.
Analysis is performed on the supernatant from each well.
Typical results
C57BL/6 mice were immunized with MOG35-55/CFA, or with MOG35-55/CFA followed by pertussis toxin injection. Eleven (11) or 27 days later, spleen or lymph node cells were restimulated with MOG35-55 for 72 hours. Cytokine production was compared across a range of MOG35-55 concentrations (0.0, 0.7, 2.2, 6.6, and 20.0 µg/mL) and analyzed using a cytometric bead assay (CBA) in accordance with the manufacturer's instructions.


Proliferation analysis (BrdU staining)
Cell proliferation can be analyzed by culturing cells in the presence of bromodeoxyuridine (BrdU), a thymidine analog. As cells proliferate in culture, the BrdU is incorporated into DNA in place of thymidine. The presence of BrdU can be detected with anti-BrdU antibodies.
Spleens or lymph nodes are collected and cell suspensions are setup in 48-well plates with multiple concentrations of antigen for 48 to 72 hours.
BrdU is added to wells for 3 to 4 hours. Cells are then collected, stained with anti-BrdU antibodies, and flow cytometry is performed.
Typical BrdU results
Below are typical results from a proliferation assay using lymph node cells taken 11 days post-immunization from MOG35-55-immunized C57BL/6 mice.


Please contact Hooke at or with questions or for a quotation.
References
[1] Rangacharia, M and Kuchroo V., J Autoimmun 45:31 (2013)
[2] Thakker P et al, J Immunol 187:1986 (2011)
[3] Thakker P et al, J Immunol 178:2589 (2007)
[4] Marusic S et al, J Exp Med 202:841 (2005)
[5] Lyons JA et al, Eur J Immunol 29:3432 (1999)
[6] Mendel I et al, Eur J Immunol 25:1951 (1995)
[7] van der Veen RC et al, J Neuroimmunol 21:183 (1989)
[8] McCarron R and McFarlin D, J Immunol 141:1143 (1988)
See also
- Mouse EAE Models - Overview and Model Selection (pdf slides)
- Mouse EAE Scoring
- Rat EAE Scoring
- Adoptive Transfer EAE in C57BL/6 Mice (kit protocol)
- Adoptive Transfer EAE in SJL Mice (kit protocol)
- EAE Induction by Active Immunization in C57BL/6 Mice (kit protocol)
- EAE Induction by Active Immunization in Lewis Rats (kit protocol)
- EAE Induction by Active Immunization in SJL Mice (kit protocol)
- EAE induction – What are the advantages and disadvantages of the different models and antigens? (Learning Center, re kits)
_150px.jpg)