

EAE Analysis Options
As part of our CRO services, Hooke offers a wide range of tissue collection and analysis. Of course, we are also happy to ship your samples to a lab of your choice anywhere in the world.
Hooke performs:
- Tissue and blood collection (for PK analysis, etc.)
- Histological, immunohistochemical (IHC), and immunofluorescent (IF) analysis of tissue
- Flow cytometric analysis
- CNS-infiltrating, lymph node, spleen cells
- Cell surface staining
- Intracellular staining
-
Analysis of T cell functions in vitro (antigen re-stimulation)
- Cytokine production analysis – ELISA, cytokine bead assay (CBA), Luminex, MSD
- Proliferation analysis (BrdU staining)
Some customers order analysis of all groups in advance, but we generally encourage customers to wait for initial results before deciding which analyses to order.
We usually quote a price for your base study, together with prices for additional analysis that may be ordered later. This gives you flexibility to analyze only a sample of animals, choose particular groups for analysis, or even skip analysis completely if the results aren't promising. Our scientists will review your initial results with you, and can recommend the best analyses to maximize return from your study.
We generally ask for 5 day's notice to schedule tissue collection or analysis (but we do our best to accommodate last-minute orders).
Histological and immunohistochemical (IHC) analysis
Histological and IHC analyses provide additional readouts of drug efficacy, independent of clinical observations. While these analyses provide valuable information about EAE severity, they must be evaluated with a knowledge of the course of EAE.
Tissue sections are typically stained with hematoxylin and eosin (H&E) and anti-MBP. Our standard analysis includes:
- Count of inflammatory foci (H&E)
- Count of apoptotic cells (H&E)
- Estimate of demyelination (anti-MBP)
Other frequently performed analyses include:
- anti-CD4
- anti-Iba1
- anti-GFAP
Typical findings in spinal cords
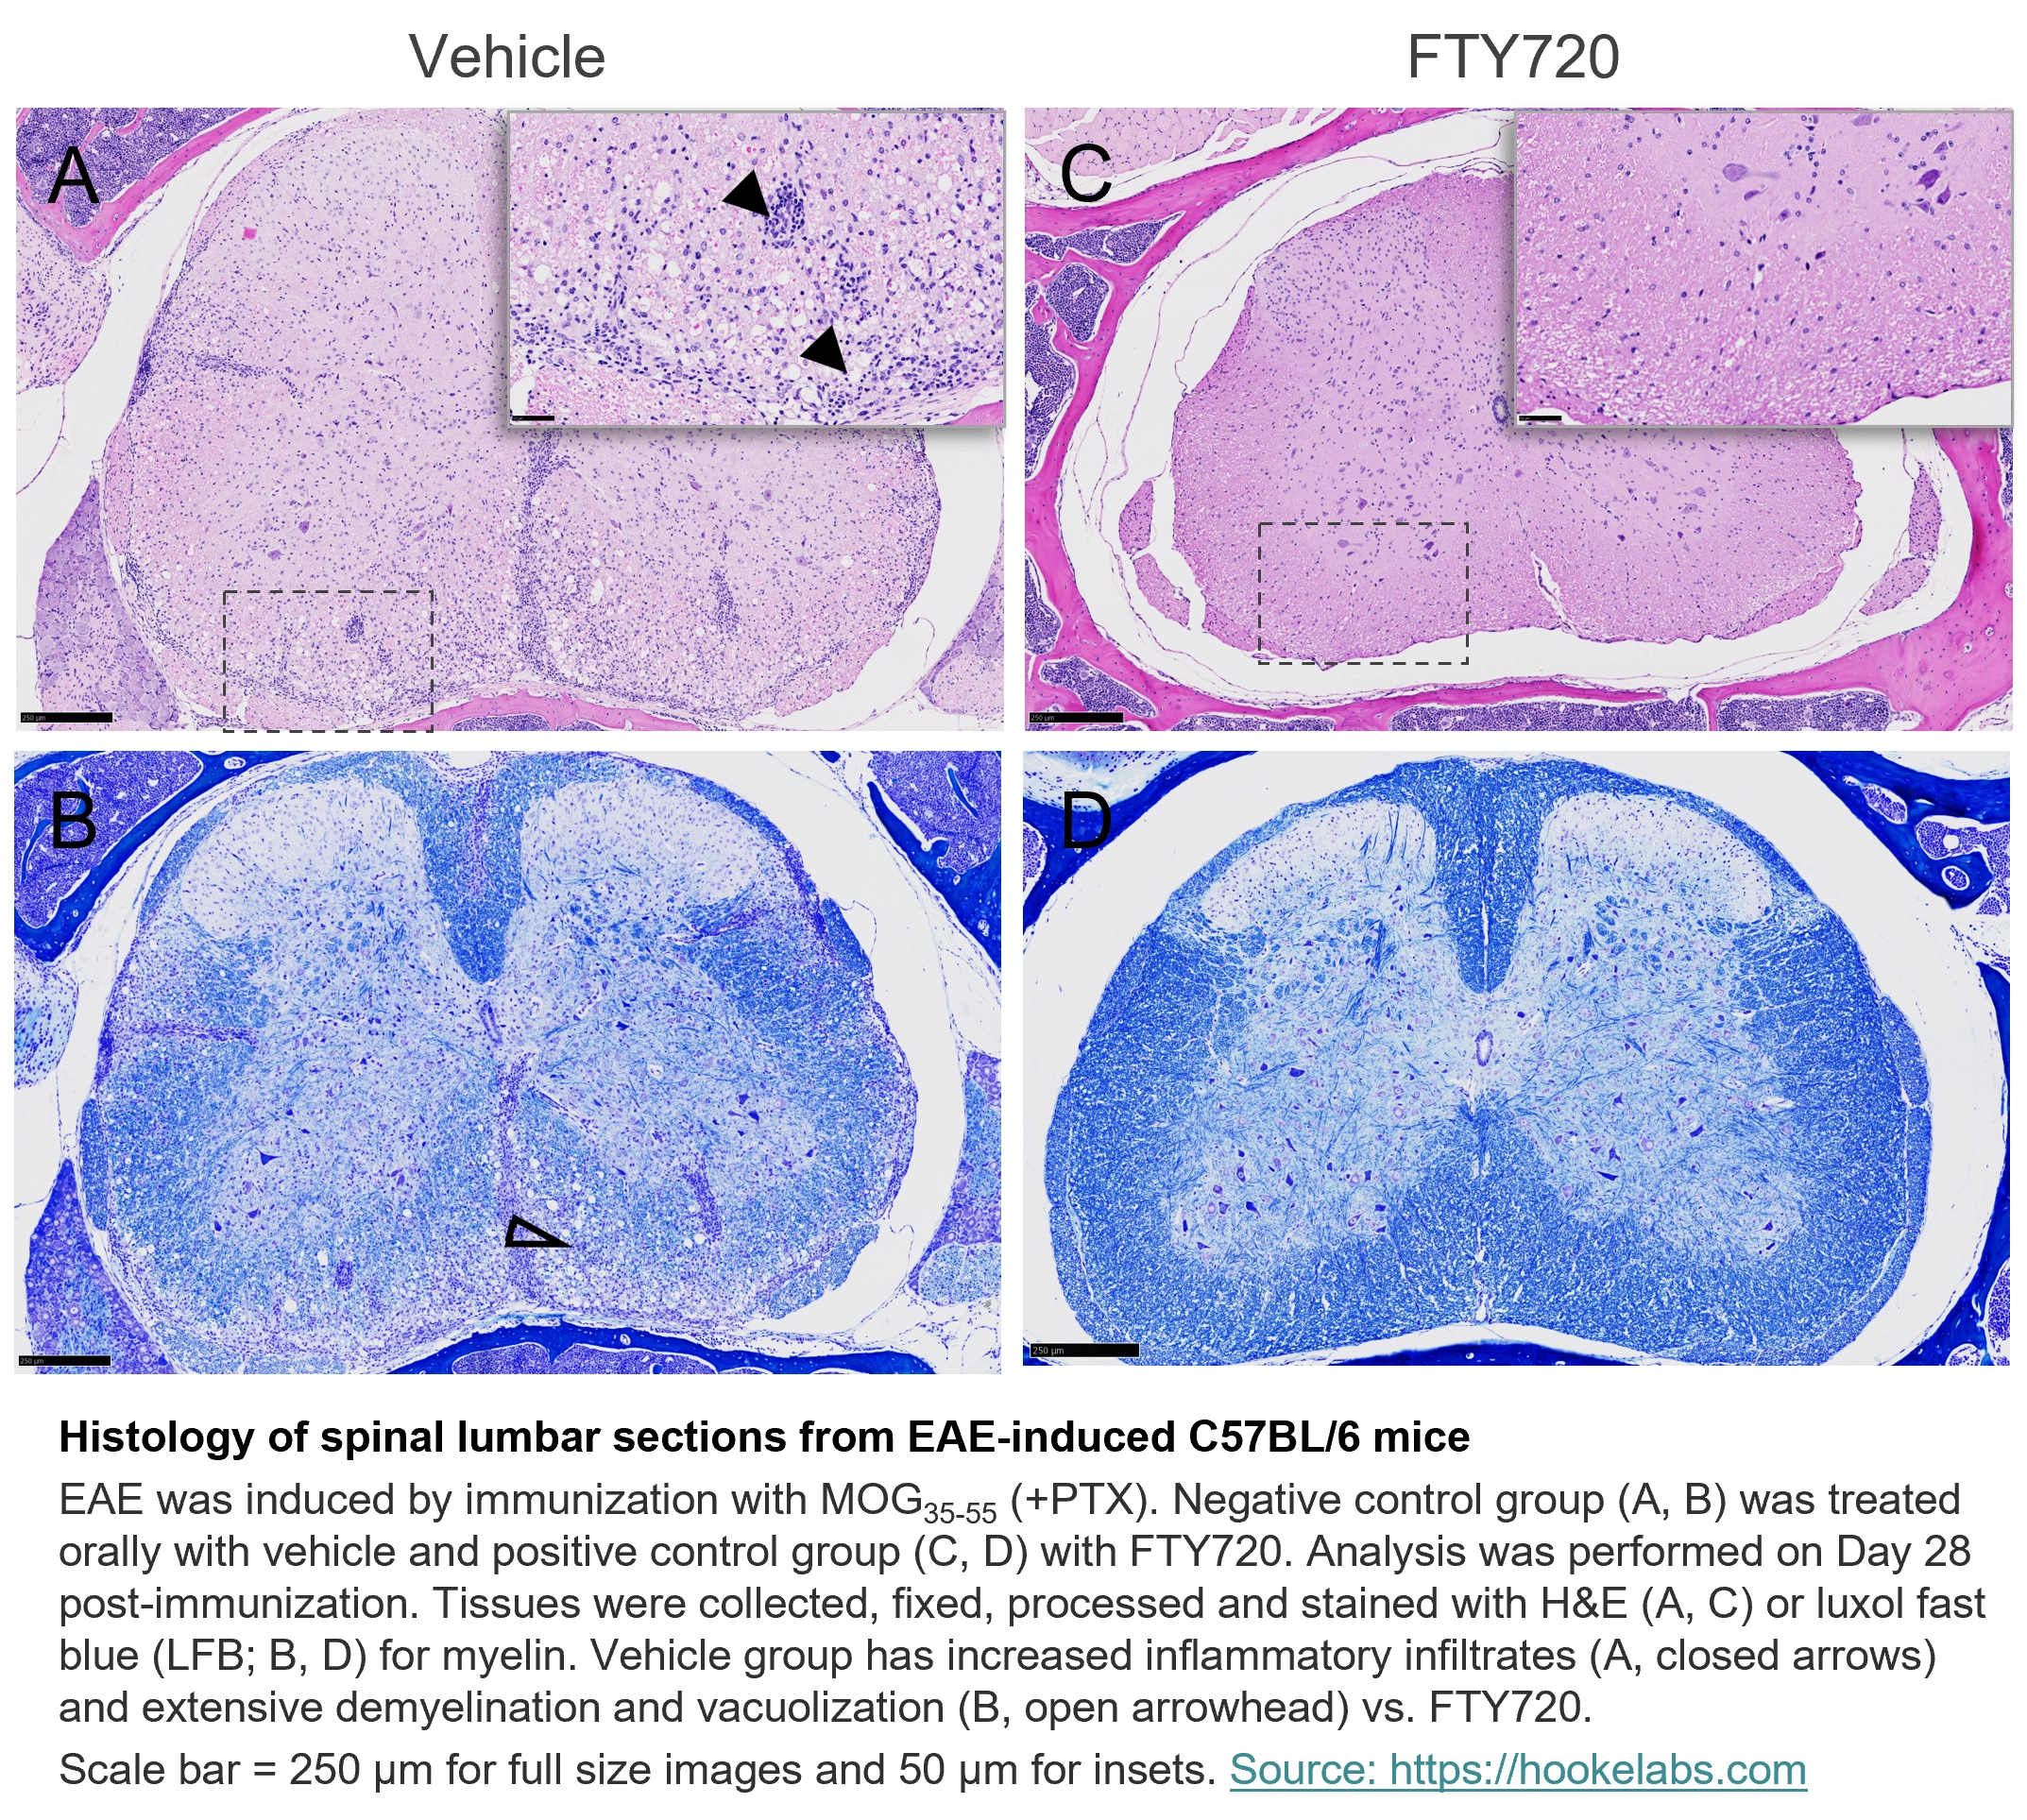
Histology of spinal lumbar sections from EAE-induced C57BL/6 mice
EAE was induced by immunization with MOG35-55 (+PTX). Negative control group (A, B) was treated orally with vehicle and positive control group (C, D) with FTY720. Analysis was performed on Day 28 post-immunization. Tissues were collected, fixed, processed and stained with H&E (A, C) or luxol fast blue (LFB; B, D) for myelin. Vehicle group has increased inflammatory infiltrates (A, closed arrows) and extensive demyelination and vacuolization (B, open arrowhead) vs. FTY720.
Scale bar = 250 µm for full size images and 50 µm for insets.
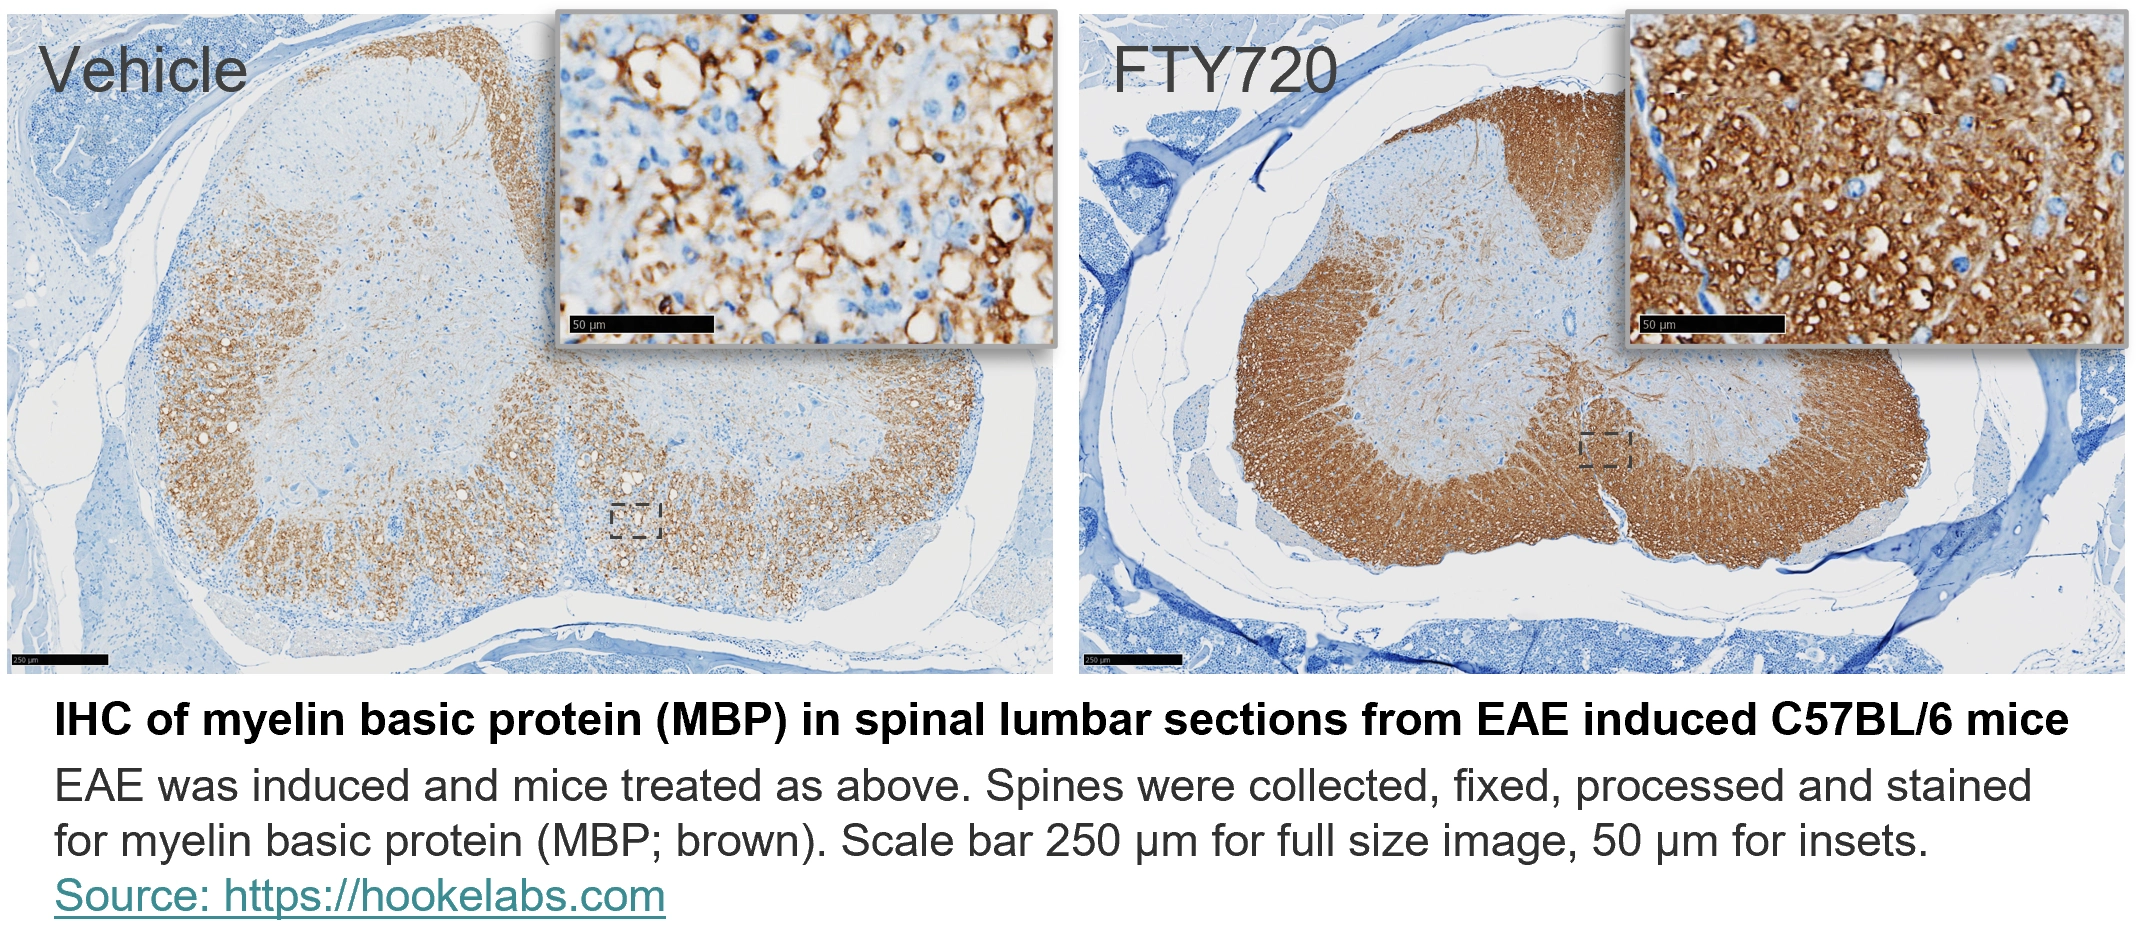
IHC of myelin basic protein (MBP) in spinal lumbar sections from EAE induced C57BL/6 mice
EAE was induced and mice treated as above. Spines were collected, fixed, processed and stained for myelin basic protein (MBP; brown).
Scale bar 250 µm for full size image, 50 µm for insets.
(Click for larger image.)
Flow cytometric analysis
Hooke offers flow cytometric analysis, which can help confirm or identify the mode of action of your compound.
We normally have a wide range of antibodies in stock and routinely perform 15 color analysis. We perform both surface and intracellular staining.
Most often we analyze CNS-infiltrating cells from brain or spinal cord. Spleen and inguinal lymph node cells are also frequently analyzed.
Typical flow cytometric results - CNS-infiltrating cells in chronic EAE
Below are typical results from cell surface and intracellular staining of CNS-infiltrating cells from a C57BL/6 mouse with EAE.
Spinal cords were collected and infiltrating cells isolated using a Percoll gradient, then cells counted.
Cells were placed in culture with phorbol myristate acetate (PMA, 50 ng/mL), ionomycin (1 µg/mL), brefeldin (1 µg/mL), and monensin (1.36 µg/mL) and incubated for 4 to 5 hours, then washed and stained.


Ex vivo T cell function analysis (restimulation with antigen)
Spleen and lymph node cells are restimulated with antigen to analyze cytokine production of T cells in vitro. This can be performed either as a separate study, or the end of an EAE study.
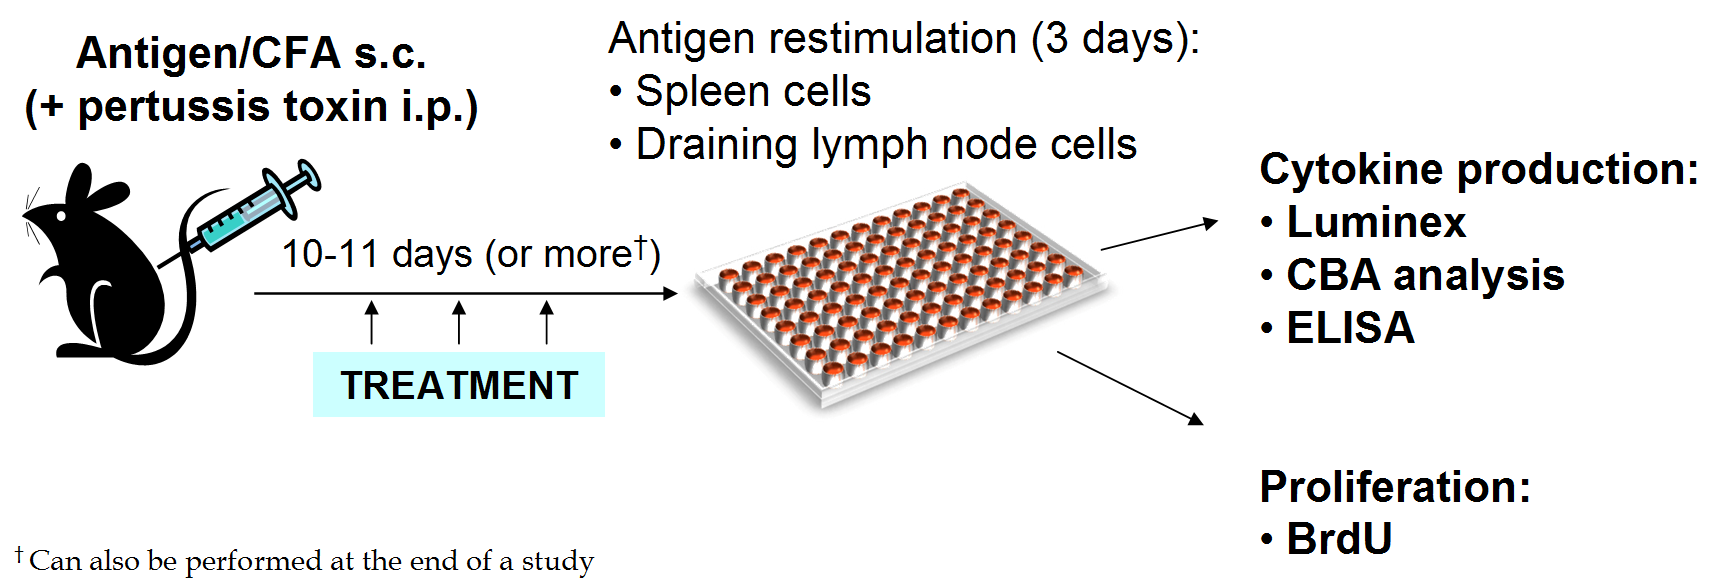
Spleens or lymph nodes are collected and cell suspensions plated in 96-well plates with multiple concentrations of the selected antigen in triplicate.
After 72 hours of culture, supernatants are collected and analyzed for cytokines using Luminex, ELISA, or CBA.
Analysis is performed on the supernatant from each well.
Typical results
C57BL/6 mice were immunized with MOG35-55/CFA, or with MOG35-55/CFA followed by pertussis toxin injection. Eleven (11) or 27 days later, spleen or lymph node cells were restimulated with MOG35-55 for 72 hours. Cytokine production was compared across a range of MOG35-55 concentrations (0.0, 0.7, 2.2, 6.6, and 20.0 µg/mL) and analyzed using a cytometric bead assay (CBA) in accordance with the manufacturer's instructions.


Proliferation analysis (BrdU staining)
Cell proliferation can be analyzed by culturing cells in the presence of bromodeoxyuridine (BrdU), a thymidine analog. As cells proliferate in culture, the BrdU is incorporated into DNA in place of thymidine. The presence of BrdU can be detected with anti-BrdU antibodies.
Spleens or lymph nodes are collected and cell suspensions are setup in 48-well plates with multiple concentrations of antigen for 48 to 72 hours.
BrdU is added to wells for 3 to 4 hours. Cells are then collected, stained with anti-BrdU antibodies, and flow cytometry is performed.
Typical BrdU results
Below are typical results from a proliferation assay using lymph node cells taken 11 days post-immunization from MOG35-55-immunized C57BL/6 mice.


Please contact Hooke at or with questions or for a quotation.
_150px.jpg)