

CD4+CD45RBhigh-Induced Colitis in SCID Mice
Inflammatory bowel disease (IBD)
Inflammatory bowel disease (IBD) is an inflammation of all or part of the human gastrointestinal (GI) tract. The most common forms of IBD are ulcerative colitis, which affects the colon, and Crohn's disease, which can affect any part of the GI tract (but most often colon and terminal ileum).
CD4+CD45RBhigh-induced colitis in SCID mice
We consider this the closest rodent model to IBD in human patients, and see excellent disease development in this model at Hooke. Pathological findings and weight loss resemble findings in human patients, and most IBD therapies efficacious in humans also reduce colitis in this model.
The main difference between this model and human disease is the location of lesions - in mice pathological findings are restricted to the colon, while in humans they can be present in any part of the GI system, although they are usually present in the colon.
Colitis in this model is believed to develop as a result of an imbalance between different CD4 cell populations [1, 2].
Disease is induced by injecting Treg-depleted, purified CD4+CD45RBhigh cells into severe combined immunodeficient (SCID) mice (which lack T and B cells). Only CD4+CD45RBlow cell populations contain regulatory T cells; CD4+CD45RBhigh populations do not.
Colitis does not develop when CD4+ cells (containing both CD4+CD45RBlow and CD4+CD45RBhigh cells) are injected, or when separately purified CD4+CD45RBlow cells (containing Tregs) and CD4+CD45RBhigh cells are co-injected into mice. Therefore it appears that regulatory T cells prevent colitis development.
Colitis also does not develop when germ-free SCID mice are used [3]. This implies that the CD4+CD45RBhigh cells generate an immune response against commensal bacteria in the colon; if Tregs are not present to down-regulate the immune response, disease develops.
Colitis appears to be mediated primarily by Th1 cells. Proinflammatory cytokines play an important role in colitis development; blocking IFNγ, IL-12/IL-23 or TNF reduces or blocks disease development [4, 5]. The role of Th17 cells is unclear; similar to findings in human patients, anti-IL-17A antibodies do not inhibit disease in this model.
Please contact Hooke at or with questions or for a quotation.
Disease induction
Spleens from BALB/c mice are collected to obtain CD4+ and CD4+CD45RBhigh cells. We prepare a spleen cell suspension, then isolate CD4+ and CD4+CD45RBhigh cells (which are also CD25-) and verify that Treg cells are not present among CD4+CD45RBhigh cells.
Colitis is then induced by injecting the purified CD4+CD45RBhigh cells into recipient SCID mice. After 3 to 6 weeks, colitis develops as the cells are activated in the colon.
We inject a group of SCID mice with CD4+ cells to establish a negative control group for colitis development. (Alternatively, naïve SCID mice can be used for the negative control group instead of CD4-injected mice, to save expense.)
Colitis induction in SCID mice

Readouts
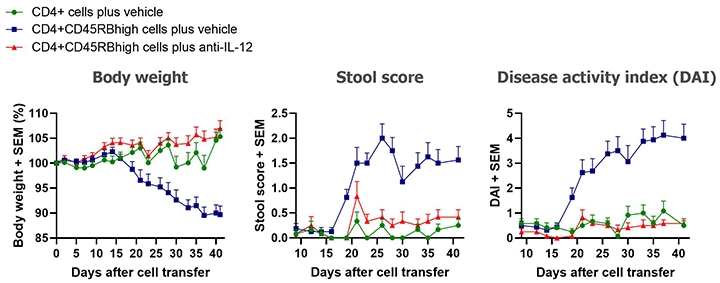
Clinically, the presence of colitis is indicated by weight loss and stool softening. Clinical disease usually starts developing 2 to 3 weeks after the cell transfer. Colitis becomes severe 5 to 6 weeks after the cell transfer.
Typical results from studies at Hooke are shown below.
Our standard in vivo readouts are body weight and stool score, both taken three times per week. Body weight loss scores are a scale from 0 to 4, with higher numbers representing more weight lost. Stool scores rate stool consistency from 0 to 4, with 0 representing normal stool and 4 representing diarrhea. Disease activity index (DAI) is the sum of body weight and stool scores.
Typical results from mice euthanized Day 43 post-cell transfer are shown below; groups were compared using one-way ANOVAs followed by Tukey’s multiple comparisons tests.
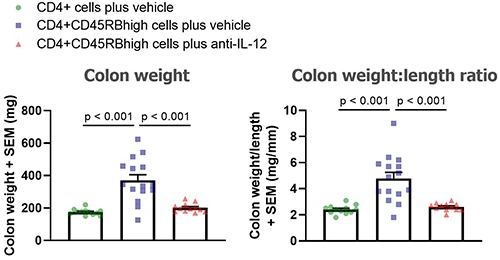
At the end of the study mice are euthanized and colons collected, cleaned and analyzed:
- Colon weight and length determined
- Distal 1/3 of colon dissected and divided longitudinally. Half is snap frozen for possible myeloperoxidase (MPO) analysis. The remaining half is placed in culture and the supernatant collected after 24 hours for possible cytokine analysis.
- Proximal 2/3 of colon is made into "Swiss Rolls" and fixed in buffered formalin for possible histological analysis. Histology is the main readout in these studies. Alternatively, this proximal piece can be used for lamina propria isolation and flow cytometry.
Analyses offered
Some customers order analysis of all groups in advance, but we generally encourage customers to wait for initial results before deciding which analyses to order.
We usually quote a price for your base study, together with prices for additional analysis that may be ordered later. This gives you flexibility to analyze only a sample of animals, choose particular groups for analysis, or even skip analysis completely if the results aren't promising. Our scientists will review your initial results with you, and can recommend the best analyses to maximize return from your study.
We generally ask for 5 day's notice to schedule tissue collection or analysis (but we do our best to accommodate last-minute orders).
MPO, histological, and cytokine analyses can be requested within 30 days after termination of a study.
The following are the most commonly ordered analyses in colitis studies.
MPO analysis
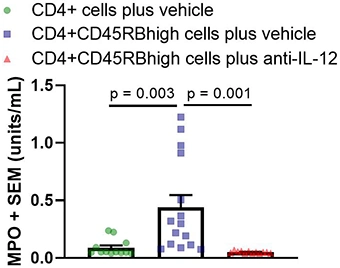
Myeloperoxidase (MPO) is an enzyme that catalyzes the formation of reactive oxygen species and is a biomarker for colitis. Activity is based on a colorimetric assay with a readout of enzyme units/mL. MPO analysis is performed on colon tissue homogenate. Each sample is run in triplicate.
Below are typical results from mice euthanized on Day 43 post-cell transfer. Groups were compared using a one-way ANOVA followed by Tukey’s multiple comparisons test.
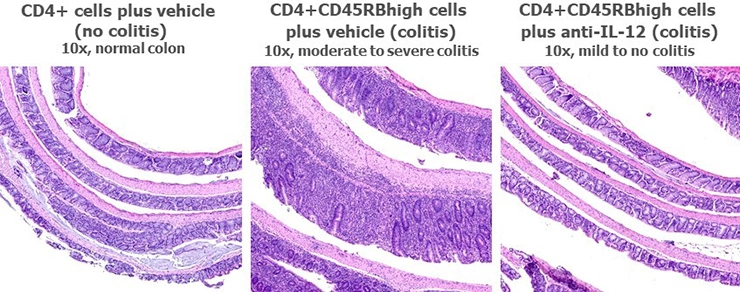
Histological analysis of colons
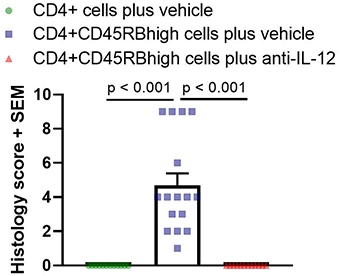
Histological analysis is the main readout in these studies and is performed on Swiss-rolled colons. One H&E section is prepared and analyzed for each mouse. Scoring is based on inflammation present in the mucosa, submucosa, and muscularis propria, and is performed blind. Below are typical results from mice euthanized on Day 43 post-cell-transfer. Groups were compared using a one-way ANOVA followed by Tukey’s multiple comparisons test.
Flow cytometric analysis of cells
For analysis of lamina propria cells, the proximal 2/3 of colons (otherwise used for histology) is digested with collagenase, and lamina propria cells are isolated on Percoll gradient. A separate cell suspension is prepared from each animal and cells counted.
Cells are stained and analyzed by flow cytometry. The customer can select up to 15 markers for each analysis. Multiple analyses can be performed on each animal.
We normally have a wide range of antibodies in stock and routinely perform 15 color analysis. We perform both surface and intracellular staining.
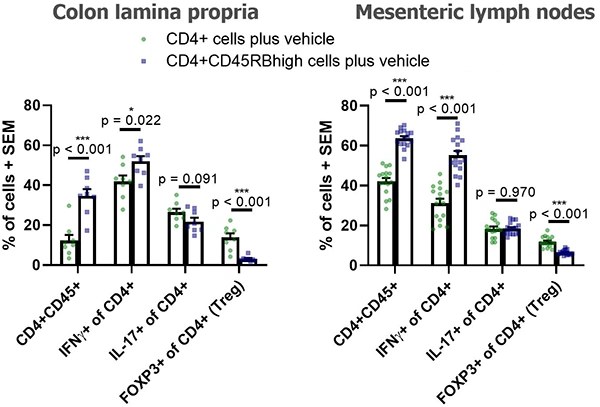
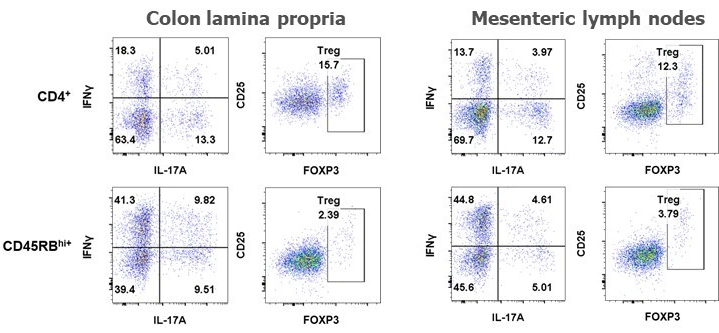
Below are typical results of flow cytometric analysis. Mice received either CD4+ cells (negative control for colitis, n=8) or CD4+CD45RBhigh cells (colitis-induced group, n=16). Four weeks after cell transfer, colon lamina propria cells and mesenteric lymph node cells were isolated and stained with CD45, CD4, CD25, FOXP3, IL-17A, and IFNγ (*p < 0.05, ***p < 0.001). Representative dot plots from individual mice are also shown. Groups were compared using a two-tailed Student’s t test for each cell population.
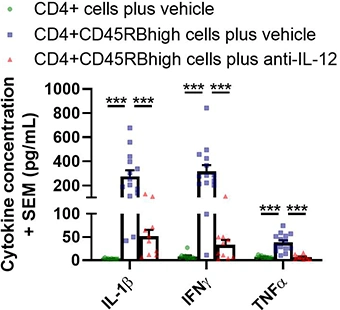
Cytokine analysis of colon culture supernatants
Supernatants from colon culture are analyzed using a multiplex platform. Typical results from a Hooke study are shown below (analysis from Day 42 post-cell-transfer; ***p < 0.001). Groups were compared using a one-way ANOVA followed by Tukey’s multiple comparisons test for each cytokine.
Cytokine concentrations in colon culture supernatant
References
[1] Powrie F et al, Int Immunol 5:1461 (1993)[2] Powrie F et al, J Exp Med 183:2669 (1996)
[3] Stepankova R et al, Inflamm Bowel Dis 13:1202 (2007)
[4] Powrie F et al, Immunity 1:553 (1994)
[5] Liu Z et al, Eur. J Immunol 31:1550 (2001)
_150px.jpg)