

Atopic dermatitis induced by MC903 in C57BL/6 mice
MC903-induced dermatitis is run in C57BL/6 mice as a model of human atopic dermatitis (eczema).
Atopic dermatitis
In human patients atopic dermatitis (eczema) is the most common chronic skin disease. It is characterized by redness, itchy skin, epidermal hyperplasia, and scaling. Patients often have increased serum IgE.
The disease typically begins within the first few months of life and impacts 15 to 20% of children and 1 to 3% of adults worldwide. It likely results from genetic predisposition and complex environmental factors. It appears that both skin barrier dysfunction and immune dysregulation contribute to disease development. Skin inflammation is dominated by Th2 and Th17 responses.
In addition to topical moisturizers, corticosteroids, and phototherapy, FDA approved treatments for atopic dermatitis include:
- Eucrisa (crisaborole, a phosphodiesterase-4 inhibitor)
- Dupixent (dupilumab, an IL-4Rα blocking monoclonal antibody)
- Protopic (tacrolimus, FK506, an immunosuppressant)
MC903-induced dermatitis
MC903 is a vitamin D3 analog which, when topically applied to mouse skin, induces inflammatory cellular infiltration, Th2-dominated cytokine responses, scaling, and erythema analogous to human eczema. Topical application of MC903 also induces increase in serum IgE.
Disease induction
This is a 10 day model in female C57BL/6 mice. MC903 is applied daily to one ear. Therapeutic treatment usually starts 2 days after the first MC903 application (just prior to appearance of symptoms).

Readouts
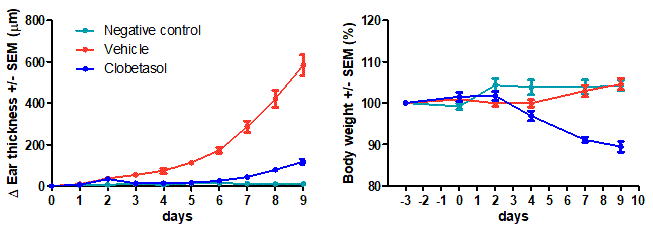
Our standard in vivo readouts are mouse weight and ear thickness.
At the end of the study the following measurements and analyses are typically performed:
- Ear thickness
- Ear weight
- IL-4 concentration in ear homogenate
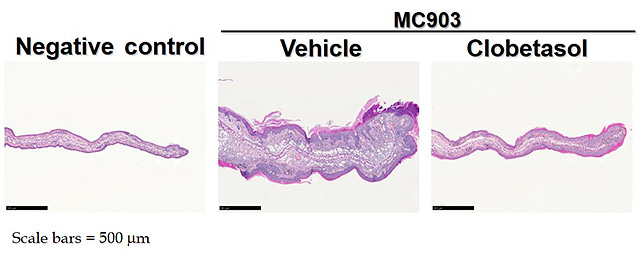
- Ear histology
- Flow cytometric analysis of ear infiltrating cells
Please contact Hooke at or with questions or for a quotation.
Typical results
The results below are from a representative study performed at Hooke. Mice received either vehicle (negative control for disease) or MC903 to induce disease, every day for 9 days (Days 0 to 8). From Day 2 until sacrifice, mice that had disease induced with MC903 were treated daily with vehicle or clobetasol.
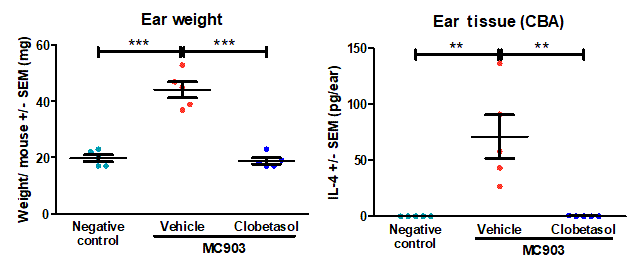
** p<0.01, *** p<0.001, error bars are SEM. Statistical analysis used Student’s T-test comparing to vehicle/MC903 control.
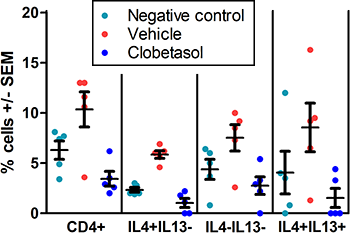
Ears were collected and digested. Infiltrating cells were isolated, strained, and assessed by flow cytometry. CD4 cells are plotted as % of live cells, intracellular cytokine stained cells are % of CD4+CD44+FOXP3- population.
Error bars are SEM.
References
Li M et al, PNAS 103(31):11736 (2006)
Palmer CN et al, Nat Genet. 38:441 (2006)
Moosbrugger-Martinz V et al, Methods Mol Biol. 1559:91 (2017)
_150px.jpg)